Saturday, November 19, 2016

Real Solar Results

We now have solar results from the dead of winter from two systems.

Winter power in Seattle

Using the demo solar panel a typical winter day generated 153Whrs. This was generated on a 265W Grape Solar panel. This was measured by a custom device which filled a capacitor every 30 minutes and watched the rate of fill at various levels, from that it could calculate at what voltage the fill rate was fastest and thus the max wattage that could be gotten from the panel.

Using a real array the one winter day generated 1500Whrs across 9 panels or 166Whrs per panel. The panels were Astroenergy 315W ASM6612P-315. This was harvested using a MorningStar TS-MPPT-45 to a large battery bank already under load (plenty of power to absorb). While this is only the first clean day of data, it felt like a pretty typical weather day.

Because the year-long gathering of test data from the demo panel is matching the larger and production-ready version, we can extrapolate a few things about what the solar power system can be used for...

How much power we get in the winter: We can only run 62W continuous assuming perfect batteries. Thus, more like 50W only during the winter. Really, enough for maybe the freezer and the router but that's about it. This system generates just 12% of our daily power use.

How much power we get in the summer: We expect the 1.2kwhrs*9panels = 11kwhrs or 450W continuous load or practically the entire power use of our house during the summer.

Wednesday, November 18, 2015

Bacon-days and the value of financial freedom

I'm big on saving; I'm even a disciple of Mr Money Mustache. But an exercise in happiness ROI I did recently got me wondering about whether our consumerism is the most rational choice.

To measure the ROI of any investment in happiness, we need a system for measuring happiness. I propose the use of 'bacon-days'. One bacon-day is the enjoyment you get from eating one piece of bacon every day. I like this measure because I can always remember or re-experience exactly how much happiness a piece of bacon gives me. We can use bacon-days to estimate the happiness we get from something compared it's cost.

First, let's estimate the happiness ROI of acquiring financial freedom. I'd say not having to work is about the same happiness as having a piece of bacon every 5 minutes. So, 8hrs/day * 60mins/hr / 5mins/bacon = 96 bacon-days. That's the return. What's the investment? Over the last 50 years the S&P500 increased an average of 7.2% per year after inflation. If you had $2M at 7.2% you'll be making $12k/month before taxes. That's a good salary with some buffer. Now we can calculate the ROI. That yields a total of 96/$2,000,000 = 4.6E-5 bacon-days/dollar.

Now let's compare that to something else I want. For example, a bean bag chair. My wife and I will only be able to cuddle in it for once a week to watch a movie. During that time I'll enjoy it equivalent to about 4 pieces of bacon when compared to the current setup of two separate chairs. 1/7 week/day * 4 bacon/week = 0.57 bacon-days. That yields a total 0.57/$130 = 4.4E-3 bacon-days/dollar. Wow! I want that chair two orders of magnitude more than I want financial freedom!

But the chair is an easy example; everyone owns and believes in the value of chairs. What about something that really seems frivolous? For example, I want a plasma cutter. I do a little metal-work and I already own a band saw that does pretty much the same thing. But a plasma cutter would do it faster and I could do some more complex cuts. A plasma cutter and the compressor it needs to run will probably cost me ~$2000. Historically speaking I do a substantial metal-working project every 3 months or so (making a ladder/water-tower, making shelves, making railings, throwing a welding party, etc.) In any given project I'm probably making ~20 cuts. The joy I will get from making a cut with a plasma cutter instead of waiting on that noisy band saw is at least the same enjoyment I get from eating a piece of bacon. That works out to 1/90 projects/day * 20 cuts/project * 1 bacon/cut = 0.22 bacon-days. That yields a total of 0.22/$2,000 = 1.1E-4 bacon-days/dollar. That's still more than double the ROI of financial freedom.

Does this means I should pursue buying such seemingly frivolous things instead of saving for early retirement? It seems like it. I know these simple equations don't consider the value-decay of objects over time, but when something is an order of magnitude more ROI, unless it'll break that year or the next we can often discount value-decay. I'll have to think about it more.

Sunday, July 19, 2015

House now has solar power

The solar monitor told me my one panel was making 1.2kWH/day. It's time to actually use that.

The cheap solar setup I made uses a $30 charger and a $40 inverter. I already had 4 old lead-acid batteries in a scooter I didn't use and I'd previously bought the most expensive part; the panel.

All told, it took about another $100 worth of switches, cabling, conduit, etc. But now we generate 1.2kWH/day, can store 400WH, and can use up to 400W at a time. Not a lot, but my chest freezer uses ~800WH/day so once the system is proven I'll probably have it run that.

Sunday, June 21, 2015

Solar Monitor V1

The goal: Understand how much power a solar panel actually makes.

The most straightforward way to measure DC power is to give your source a resistive load and measure voltage across it. Power = Voltage^2 / Resistance.

Challenges we face: The problem with solar panels is that they can't be approximated as constant-voltage or constant-current. So just one resistor isn't enough. Further, I don't want to have to run power or networking outside. So whatever device does this measuring it needs to itself run off of the solar power and either save that information or convey it wirelessly.

Solution: First, let's use an 'Arduino Yun'. This is an arduino printed on the same PC board as a linux machine with the serial connection and software already made between them. So the linux machine can do the networking side of it while the arduino can do the more typical microcontroller functions; turning the resistors on and off and measuring their voltage.

For power, we can use voltage regulators 7812 and 7805 to bring the 38V of the solar panel down to 12V where a battery will store it and then down to 5V where the arduino will consume it. With a large battery, it should have no problem lasting the night even in the low-light winter.

We also want monitoring, manual control, and safeguards.

Monitoring: For monitoring, I'll put an LED on the power coming in from the solar panel, and then one on each of the resistor networks to see if they get pulled low.

Manual control: For manual control, let's add three light switches (because they're cheap) to turn on overall power from the solar panel, power from the battery to the microcontroller, and then turning on or off the monitoring LEDs. Having LED control lets me turn them off when they'd otherwise be sapping power. Having two levels of power control let me boot the microcontroller only if I want to debug, or boot it first to get around uncertainty in startup, or not boot if the battery is dead, etc.

Safeguards: The resistors could take as much as 260W at peak but I don't want to buy and don't need a 300W resistor because I'll only be pulsing that power on for a moment to take a reading. Then it will have plenty of time to cool down. Unless something breaks... if power does stay on while the resistor is turned on, it could heat up, burn, and short out other parts. So I'll put in fuses in a few key parts to make sure if it does go melty it doesn't stay melty. I could also have a secondary system montor heat, but the complexity of the machine increases dramatically if I do that.

Results

It had two problems: First, it doesn't have enough grainularity of load. At full sunlight with 2ohms it did 16V and about 124W. But then at 8ohms it did 28V and about 100W. It should have been doing at least 200W and perhaps it would have been had it been at the ideal voltage of 24V. Perhaps solar cells have a much tighter wattage curve than I knew.

Second, it melted itself. Something bad happened and the 2ohm resistor must have stayed on. It was on until it melted the acrylic holding it in place, charred part of it's outer surface and eventually internally ruptured it's connection thus ending the short.

So the data was not good enough and the device was damaged. Need a new plan. :)

Sunday, March 1, 2015

The Inconvenient Message Detection (IMD) prototype is done

Github URL, how to use it is in the ReadMe: https://github.com/DickingAround/InconvenientMessageDetection

The problem:

Who talks to who and who uses encryption is obvious to a mass-observer (e.g. the NSA). Large encryption keys and encrypted data are hard to hide. This leaves the meta-data of communication open for observation. It also leaves people using encryption vulnerable to coercion; an individual in power could demand they decrypt their communications.

The goals:

  • Obscure who talks to who without requiring broad adoption of a new technology.
  • Increase the cost of mass-observation.

Two communicating parties have to transmit something. The smallest message that can be transmitted is a single bit; 'there is a secret'. If it is reasonable to transmit this datum through insinuation, pre-determination, or other meat-space methods, then the meta-data of the communication is hidden.

The solution we've made:

Steganography that requires computing effort. Steganography is the idea of hiding data in the unimportant bits of an image. This is an old idea. The new twist is that with 'Inconvenient Message Detection' (IMD) that data can only be found if the decoder does an amount of computational work that's decided by the encoder.

Let's look at how this solved our problem: If some people use IMD, it makes every image suspect. When a mass-observer wants to see what communication is going on, they must use compute power to check every image. Furthermore, because the compute effort needed to find an image is set by the encoder, it is uncertain to the mass-observer; they never knows for certain if they've worked hard enough. By contrast, the intended recipient of a message presumably got the single datum that a message exists in some public image and will put in as much compute effort as is needed to find the data in that single image. Having every image on the internet be a potential carrier of secrets makes the mass observation of communication meta-data expensive and uncertain.

Furthermore, even a individual under direct observation can increase their protection with IMD. An individual may own thousands of images of which only one contains an secret. Until the secret is found by an observer, the individual has plausible denyability of the secret's existence. The observer may even give up before spending the necessary compute effort to find it. This increases their resistance to coercion.

The current program is only a prototype. I am a competent engineer, but not professional in security, encryption, or steganography. I am more than open to advice and help. (And here's thanks to all those who have already helped craft and refine this idea and implementation so far.)

How does it work, at a high level:

Obfuscation:

  1. The image is hashed to create a number. That number is used to encrypt the file to be obfuscated. This encryption is only done to assure the bits of the file are evenly distributes between 0 and 1, it provides no other protection.
  2. The image is hashed to create another number. That number is hashed a certain number of times as specified by the user. The result is used to seed a pseudo-random number generator.
  3. The pseudo-random number generator is then used to decide where to put the 1s and 0s of the file into the image.
  4. For each bit, there is a check to see if the pixel being changed will give away that the file exists (e.g. a '1' in a field of '0' saturated color). This check also makes sure we haven't changed the results of previous checks or written to this pixel twice.

De-obfuscation:

  1. Same as encryption step 1.
  2. Similar to step 2 except that after each hash, the image is checked to see if there is a file in it. This is continued until it finds a file or a the user stops it.
  3. Same as encryption step 2.

FAQ:

Q: Can anyone read a message hidden with IMD?

A: Yes. IMD only obscures the existence of the message. Feel free to also use encryption to make sure only the intended recipient can read the message if it is discovered.

Q: How are you making it difficult to detect changes in the image?

A: I have a basic algorithm to avoid changes that would be blatant giveaways. This algorithm also serves to show where/how a better algorithm would be implemented (it's tricky to check a pixel and than conditionally change it). The basic algorithm checks for pixels which already are or are near saturated so as to avoid them. Also, pixels that are near others with the same value are not used. I assume there are better algorithms here, but I have not had time to research it.

Q: What about image meta-data? Often images have meta-data about the camera that took them. Is this disturbed? Does it give away the existence of a message?

A: No idea. This is the #1 feature on the list for a V2 of this program.

Q: What about lossy image formats like JPEG? Isn't that the most common image on the internet?

A: Yes, but it's harder to work with. In talking to a steganography expert, I gather it should be possible to store this data in the way JPEGs or other lossy formats are encoded since they are not deterministic. But it's harder so I haven't done it yet. That work would be very valuable. If you would be willing to to that work, please don't hesitate to contact me.

Q: Why are you using python's 'random' library? It's well known that this should not be used for encryption.

A: Most encryption wants/needs a random number generator, not a pseudo-random number generator. For example, os.urandom is a source of as random as possible. We don't want real random. We want a pseudo-random number generator; a random number generator that can be seeded.

In practice the 'random' library in python is an MT19937 with a period of 2^19937 which is to say it is highly impractical/impossible to parallel-test every one of those 2^19937 possible starting positions. Thus, the library works fine for how IMD uses it.

That said, feel free to swap it out for another for your own use.

Q: Why use AES to encrypt the message before encoding it?

A: I picked a symmetric encryption algorithm at random. It's only real job is to even the distribution of bits in the secret file such that there's no pattern of more '1's or '0's in the image.

Feel free to swap it out for another for your own use.

Github URL, how to use it is in the ReadMe: https://github.com/DickingAround/InconvenientMessageDetection

Ladder to the roof is done

The roof providers 1000 more sq feet of space on our house. It was designed to hold people, plants, a hottub, etc. But there's no way to get to it.

So I built a ladder. It's welded out of 304 stainless steel using 316 stainless wire in the welds. So there's no need to paint or prevent rusting. Though it is 17' tall (tall ceilings) we estimate it only weighs about 70lbs. We actually hoisted it by hand to the second level, using people roped in to the railings and lifting. My friends are good sports. :)

Saturday, July 5, 2014

Hydro electric power for a house

Question: I have a hill in a rainy part of the world, can I build my own mini-hydro-electric plant?

We get about 40 inches per year and I have a roof about 40' by 20' that will be about 50' in the air. That works out to 2,667 cubic feet of water ever year.

Potential energy is E = M * H * 9.8 N/kg. We have 75.5 cubic meters of water at 15.24 meters of height. That works out to 11.3E6 joules. That's 3,130 watt hours. Even at a 100% efficiency I'd only get 3kWhrs per year.

Which is really unfortunate because it would have been fun to runs some pipes and I could have easily 3D printed a little hyro engine.

Monday, June 16, 2014

My house has too many fucking railings

My house is essentially done now. Little thanks to me. But I did have to build the railings. Or at least I chose to. Because I'm both a cheap skate and dumb ass. Here are some random pictures of that.

But what are random pictures without random stats?

  • 7.8 ft of 1/4" holes drilled
  • 116 square inches (0.81 square feet) of steel cuts on the saw
  • 65 ft of welding
  • 13 1/4" drill bits destroyed
  • 6 band saw blades destroyed
  • ~70 cubic feet of argon lost
  • 2,394 individual acts of machining (not including installation)

Sunday, May 11, 2014

Experiment: How much light penetrates a welding helmet?

Summary

Problem: How much light does a welding helmet block? They come in shades like '9' or '12' but the only documentation I can find defines what jobs to use what shade on. It never seems to say what the shades mean.

Conclusion: A basic 'shade 10' welding glass will block all but one part in 20,000 of low-frequency light.

A given shade number seems to allow 1/3 the light of one shade below it. So, for example, a shade 10 will allow 1/3 the light of a shade 9. Also, a shade 8 will allow 3x the light of a shade 9. A 'shade 1' appears to be equivalent to 'no shade'.

This appears to hold true only for light of wavelength green or longer. When viewing blue laser light we anecdotally saw the light appeared much dimmer than viewing green laser light of the same non-shaded intensity.

The experiment

Big thanks to Woody and Erin for helping design and do this experiment.


Original data:

Setup: We measured the shades of a Hobart welding helmet with a variable shade and a regular no-brand set-shade welding helmet. We used a LX1010B light meter inside the helmet, with cloth packed around it to shield light. Without any of the lights on, the sensor read '0' on it's most sensitive setting.

For each measurement, we took one of two flashlights and shone them through the helmet and centered on the light meter sensor. We also shone them directly on the sensor to get a no-shade measurement. For the variable-shade welding helmet we also needed to use an extra flashlight to activate the shade (normally it stays low-shade in order to allow the welder to see before they start welding and then changes it's shade when welding begins; it uses a light sensor on a different part of the face of the helmet to do this.)

We were only able to take a few measurements but they're a highly linear pattern, consistent from one light to the next, and the measurements from the variable-shade helmet closely matched the static-shade-of-10 helmet.


Results

The relationship between lux and shade looks very linear when the lux is plotted on the log scale. At a glance, it's about 1/3 the lux for every additional 1 of shade.


What's most interesting is if we assume this 1/3rd relationship going back down the shade levels, we predict that we'll see about the same as the 'unshaded' lux measurement when we reach shade level 1. This makes sense and reinforces that we've done the measurement at least approximately correctly since I can imagine an engineer/scientist choosing the shade level 0 or level 1 to be the unshaded level.

Sunday, April 20, 2014

AIWorld6: The Tree Of Life

The Mechanics

I almost want to get immediately sentimental. But let's for a moment talk about how this tree of life was created and thus how to read it.

To explain how this is build, let's talk about what happens with a single creature. This creature will have a number that represents their species. When the creature replicates, their offspring will have a number that's either +1 or -1 from their parent's number. Using this simple scheme, over many generations different species will have numbers that drift away from each other.

By chance there will also be a lot of cross over of the numbers as species' numbers wander. To fix this I bias the probability of picking -1 or +1 based on where the other creatures are. So for example if there are 1000 creatures with the number 40 and this creature has the number 41, their offspring will likely get a +1 and be 42. This has the effect of spreading out the numbers.

Next I want to use these species numbers to see which creatures are which on the map. So I assign that number to a color. On a 0 to 255, RGB color scale I get to have 1530 different full-brightness colors; so I'll just mod the number of the species with 1530 and plot it on the color scale.

Now I have colors that represent species. How to build the tree? Every X turns I can take a census of what species there are and plot a single line where the intensity is proportional to the percentage of the population with that color. Stacking those slices on each other for tens of millions of turns gives us the full and complete tree of life.

The meaning

Now for the fun part. More accurately, now for the amazing part.

At a high level, it's the first time I've ever seen every single species ever in the tree of life. No stumpy branch or leaf in this tree is left un-turned. We don't have to rely on some spotty fossil record that we piece together by comparing physical structures. We don't even have to parse the DNA. We have a tree of life based on real heritage data. And crazier yet, this is a tree of life playing out just like all our evidence said ours did. Right in front of our eyes in a repeatable way.

Look at the long stretch of yellow and orange. Notice how the yellow is longer lived (ave age ~5000 turns vs less than 1000 turns for orange) and branching less often because replication rates are slower. If we look at the real-time video of the world we can actually see yellow being killed off by the more aggressive pink who are themselves overtaken by the more stable red species.

Look at the times when a branch fans out and then suddenly tightens. That's a small set of individuals or even a single individual which turned out to be more fit than the others and out-competed them. That property alone is what keeps the lines of the species from drifting farther from each other.

I built this system with the intention of building true causational (not correlational) studies of life. The first step of that is getting life. This looks a lot like life to me. Maybe not life just like ours. Maybe without temperature-based homeostasis and carbon. But are we so sure that's the right definition of 'life'? :)

Sunday, March 23, 2014

AIWorld6: Without the ability to be functionally different, there is no predation

Normally the predator species would evolve quite quickly (first 1000 generations) but this world goes to 50,000 generations and we never see it.

The difference is a change I made. It's clear that predation relied on a feature I just removed: When a creature attacks they steal a certain amount of energy from the creature they attack. Normally the amount of energy is a function of how much energy they already have (I was trying to model the idea of being able to eat more because you're bigger). In this world, I made it a constant (20 energy).

In retrospect, I was foolishly doing something I said I wanted to avoid: allowing the agents to be functionally different in any way. I want them to compete on brain power alone.

But it does make me wonder if somehow forcing them to compete on brain power will actually result in a less complex and less advanced world. Luckily, I have a simulator to test such things. :)

First then, I'll try to generate speciation without allowing them to be functionally different in any way; I'm going to modify the terrain. Some places will be harder to move over. Some will have less food. We'll see if that causes it. (The simulation for this is running now)

Monday, March 17, 2014

AIWorld6 GreenVsPurple

AIWorld6: New UI and abilities

New abilities

I fixed a bug that prevented them from using the signal/communication system. So now you'll be seeing a lot more signaling than they did before. As reminder, the way this works is that they can write three floating point numbers to the location they're standing on. Those numbers persist until another agent re-writes them. Any agent nearby can read the numbers from that location.

Also, I gave all the agents memory. Twenty of their outputs are saved and then fed back in as inputs the next turn.

In both cases I haven't figured out if they're using those features. Even if they are saving data to memory and communication, it could be just noise.

The new UI

The new UI shows a lot of things. For starters, I sized the world down to 200x200 and then made the UI map 600x600 so it's easier to see what each individual agent is doing.

I also gave them shapes that represent their decisions. So a 'C' shape is attacking, 'O' is replicating, '+' is growing, 'x' is turning, '^' is moving. I made the growing/turning/moving shapes small and the attacking/replicating shapes big because I want to highlight those less common activities.

The speciation is also dramatically improved. Before I'd parse their brains and then make species judgement from that. Now I just simply give an agent a number, when they replicate their spawn gets that number + or - 1. It turns out most of the time there's so much selection going on, the current generation is only 10 or 20 generations from having a single common ancestor. Thus, the numbers stay quite tight around a species. I then simply map that number to a color to make it easy to see.

This speciation improvement also made parsing species stats a lot easier. You'll notice the system now differentiates and gets statistics on predatory behaviour far easier.

Monday, February 24, 2014

AIWorld6 - The Joy of Small Data - Follow up

I got some great feedback from people, props go to rolisz for suggesting a stack exchange conversation that lead me to Kernel density estimation.

You can see from the plot of evaluated and the plot of the derivative of the plot that it'll be easy to pick out what the species are. A naive parser that just looks at the local maximums as indicating a species and local minimums as indicating the difference between species did quite well on this data. I would have guessed [14900, 15050, 15300, 15500, 15650, 15900, 16100] and the KDE with this naive parsing went with [14732, 14861, 15054, 15674, 15725, 16087]. With the exception of 15674 and 15725 being too close to each other I think it was a total win. I'll be implementing this algorithm shortly. And perhaps even showing the histogram to let a viewer second guess the automatic stats gathering if they feel the need.

Sunday, February 23, 2014

AIWorld6 - The joy of small data

I'm happy because I've failed at clustering.

I do programming in my free time and I'm working on a system that evolves artificial life an example video). This might seem like a cool-ass AI programming but it's mostly the regular drudgery of c arrays and test case writing. After all, I'm building the world, not making them smart. It's up to them to evolve smartness.

As a result, I was super psyched today when I realized I've failed at my naive approach to detecting species. I knew they'd speciated because in every world I start from scratch there's a clear moment when almost everyone dies, and then after that I see a lot of agents with low energy and a small number with 100x as much. That die-off is the start of predation. Those high energy agents are predators. And from then on, those two different types of agents are probably evolving differently. So how can I prove this? I want to gather stats on the two different kinds.

Of course, I could just check how often agents attack each other and label the ones that do it the most predators, but that's differentiating on the same thing I want to measure, which is pointless. It also doesn't scale; if there are other species doing other behaviours I want to find them too.

The first clustering algorithm I tried was simply taking a sum of all the connections in their brain and assigning a color to that number. The idea is that if agents have similar brains, they should get similar colors. So as the brain construction of two species diverges, they turn different colors. When I see a bunch of them around a given color, I know I have a species. This works ok, but it takes a lot of tuning to not get the color spectrum too wide that it's washed out or too narrow that everyone appears to be the same. Worst of all, it's still relying on my visual ability to discern where one color band ends and the next begins.

Then I tried what any thinking-inside-the-box, data-too-big programmer would do, I wrote a simple clustering algorithm that could run in linear time. Essentially, if there's a gap of more than X spaces where I see less than Y agents, it's probably a gap between species. Then I just call all the parts that aren't gaps different species. It's a shit algorithm. It takes a ton of tuning and I'm still missing the really uncommon species.

At that point, I figured it was time to call in the big guns of a real algorithm and use a real comp-sci library for it. I looked up clustering algorithms, chose one arbitrarily, and spent an hour prototyping k-means clustering using scipy. The results are shit.

For the histogram of brain sums, even if I give k-means my personal guesses ([14900,15050,15300,15500,15650,15900,16100]) it still gives me results that I'd describe as not-helpful ([14828,15072,15451,15575,15694,15825,16056]). And it doesn't even automatically give me the min-max of those means.

Which brings me to what makes me so happy. I'm reminded of all those comp-sci classes where they talked about picking the right algorithm for the problem. I have a small-data problem; there's never more than about 40k agents in the world so I can pick almost anything. I can think about why my problem is different than the generic clustering would be; outliers matter because they're under the same selection pressure as anyone else and they're still alive. Also, small clusters as equally as important as big ones since they must still be a species. I'm hoping to find an algorithm that works for me. And if I don't, I'll invent one and code it myself.

For someone who spends most of their time crunching big data and having to use simple algorithms to do it, I'm gonna love picking just the right one for my small data.

Tuesday, February 4, 2014

AIWorld6: Real Science

It's time to setup the first experiment. The system runs. The lifeforms do crazy things. Now the question is, what to start with first? Some options:

  • Is life more successful with a concept of age?
  • Is life more resilient when the population is genetically diverse?
  • Is life more resilient when the terrain diverse?
  • Do more species occur when the terrain is diverse?

So far, the interesting things I've observed are die-offs from very aggressive predators, specialization into predators and prey, and specialization based on terrain. So far the most interesting is the speciation. I think the next step will be seeing what causes a diverse set of species and then seeing if that prevents die-offs.

Tuesday, January 7, 2014

AIWorld6: Finally proof of predators

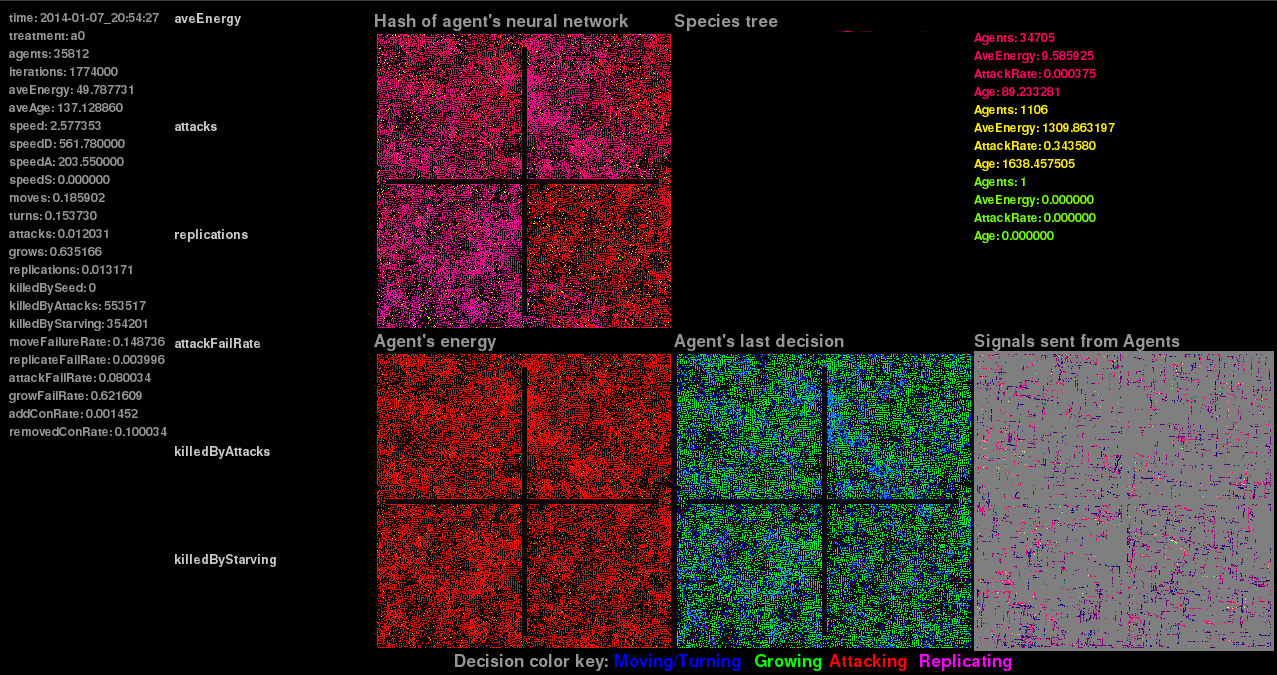
I've been working on making the system automatically detect new species; to show a species tree and then also to detect those species and show stats about them. In the course of testing, it seems like predatory behaviour evolves very often (always?) as can be seen by the faint red species tree. In the later screenshot, I've also added some code to detect them and show stats. We can see here that in fact the predators have much more energy and attack far often; just like a predator would.

Wednesday, November 6, 2013

AIWorld6: Stagnant worlds

The most common error of the previous AIWorlds were what I call 'stagnation'. Essentially, agents stop choosing to move, attack, replicate, or really do anything. The population just sits there. Every one of them.

AIWorld6 seemed to be an exception. Initially, worlds would run for >10M iterations and would stay lively. And then I found a bug. Specifically, the mutation rate was being set to 0 for a large percentage of the population. The recent evolution of predator/prey relationships was made with a world that started with the error and then the error was corrected to allow mutation again.

After correcting the error, I'm seeing stagnant worlds every time when I set the mutation rate to 0.01. Just now I tried setting the mutation rate to 0.001 and that world lasted 10M iterations.

It's clearly time to test this and find more about how and why the mutation rate affects the world's stagnation.

Sunday, November 3, 2013

Evolution of a predator-prey relationship (HD)

http://www.youtube.com/v/uCYUCqrEZqA?version=3&autohide=1&autohide=1&feature=share&autoplay=1&showinfo=1&attribution_tag=oVraH5AYPX1tfTVWnc3XyQ